You're Not an Investor. You're a Buyer.
Gold corrected 27% from its January high. If that number made your stomach drop, you're thinking about this wrong.

Gold dropped from $5,595 to $4,090 in less than three months. January's record high gave way to a brutal mid-March correction — roughly 27% off the top.
If you were watching your stack's “value” on a screen, it probably felt terrible. Maybe you opened a calculator and figured out how much you were “down.” Maybe you thought about selling part of it to stop the bleeding.
Here's the thing: that feeling isn't a problem with your gold. It's a symptom of the wrong framework.
The Speculator's Trap
The moment you start thinking of physical gold as an investment, you've already set yourself up to make bad decisions.
Investments get evaluated by returns. Returns get measured against time. And when the return goes negative — even temporarily — the speculator's brain kicks in with a simple, destructive question: should I get out before it gets worse?
So you start checking spot price every morning. You open the app, do the math, see a red number, and your stomach tightens. Another red day and you start thinking about selling — maybe just the bar you bought last month — to “lock in what you've got.”
This is a trading mindset applied to something that was never meant to be traded. And it leads to the single worst outcome in precious metals: selling physical metal at a loss during a correction, eating the dealer spread on the way out, and then watching the price recover while you sit on the sidelines trying to time your re-entry.
Ask anyone who sold gold during the 2022 pullback how that worked out.
Think Like a Buyer, Not a Trader
Think about the last car you bought. Did you buy it expecting to flip it for a profit in three years? Or did you buy it because you needed a car — and the fact that it holds some residual value was a nice bonus?
Think about your house. Did you sign the papers with a guaranteed 20% appreciation in hand? Or did you buy because you wanted a roof on your terms — equity building over time, no landlord, independence? Nobody calls a homeowner a “failed investor” because housing prices dipped for a quarter.
Physical gold works the same way.
You didn't buy it to flip it. You bought it because of what it has historically done: preserved purchasing power across decades, sat outside the banking system, and required no counterparty. That track record — while not a guarantee of future performance — is the reason most stackers hold it.
The moment you stop thinking of yourself as an investor and start thinking of yourself as a buyer, corrections stop being crises. They become what they actually are: temporary price fluctuations in a market that has trended upward over every meaningful long-term window in modern history.
Corrections Are the Engine, Not the Enemy
If you're stacking on a fixed schedule — say, $200 a month, same amount, rain or shine — a correction isn't a loss. It's a sale.
When gold drops from $180/gram to $131/gram, your $200 buys roughly 1.53 grams instead of 1.11. That's nearly 40% more metal for the same money. And when the price recovers — as it historically has after every major correction in the past two decades, though past patterns are not guarantees — those cheaper grams appreciate faster than the ones bought at the top.
This is the mechanical advantage of dollar-cost averaging.
We ran a 10-year backtest from March 2015 to March 2025 — covering the 2018 dip, the 2020 COVID spike, the 2022 correction, and the 2024–25 breakout. The fixed-dollar buyer achieved a meaningfully lower average cost per gram than a fixed-weight buyer, precisely because the dips did the heavy lifting. Buying more when prices were low, less when prices were high — automatically, without any market-timing heroics.
The corrections weren't setbacks. They were the engine.
The Real Risk Isn't the Price Drop
Here's what nobody mentions during a pullback: the danger isn't the paper loss. Paper losses in physical metals are temporary by definition — you haven't lost anything until you sell.
The real danger is making an irreversible decision based on a temporary emotion.
Once you sell physical metal, three things happen:
- You crystallize the loss. It goes from theoretical to real. Done.
- You pay the spread. In physical metals, the buy-sell spread can run 3–8% depending on the product. That's money you'll never get back.
- You inherit a new, harder problem. Now you have to decide when to buy back in. You've gone from a simple discipline (buy every month) to an impossible one (time the market).
Most people who sell during a correction don't buy back at the bottom. They buy back after the recovery is obvious — paying more per gram than their original average cost. They've turned a temporary dip into a permanent setback, not because the market failed them, but because they confused a buying plan with a trading plan.
One Question That Cuts Through the Noise
Next time gold drops and your timeline is full of takes, ask yourself one question:
Did anything change about why I started buying?
Has gold stopped preserving purchasing power? Has it suddenly acquired counterparty risk? Has the supply exploded? Have central banks stopped accumulating it?
If the answer to all of those is no — and historically it has been — then for long-term holders, the price movement may be less significant than it feels in the moment. That doesn't mean it's irrelevant — everyone's situation is different — but it does suggest that short-term moves deserve less weight than the structural reasons you started buying.
For those committed to a long-term accumulation plan, the discipline is straightforward: stick to the plan and let the math work over time.
Track Your Average Cost. Stay Disciplined.
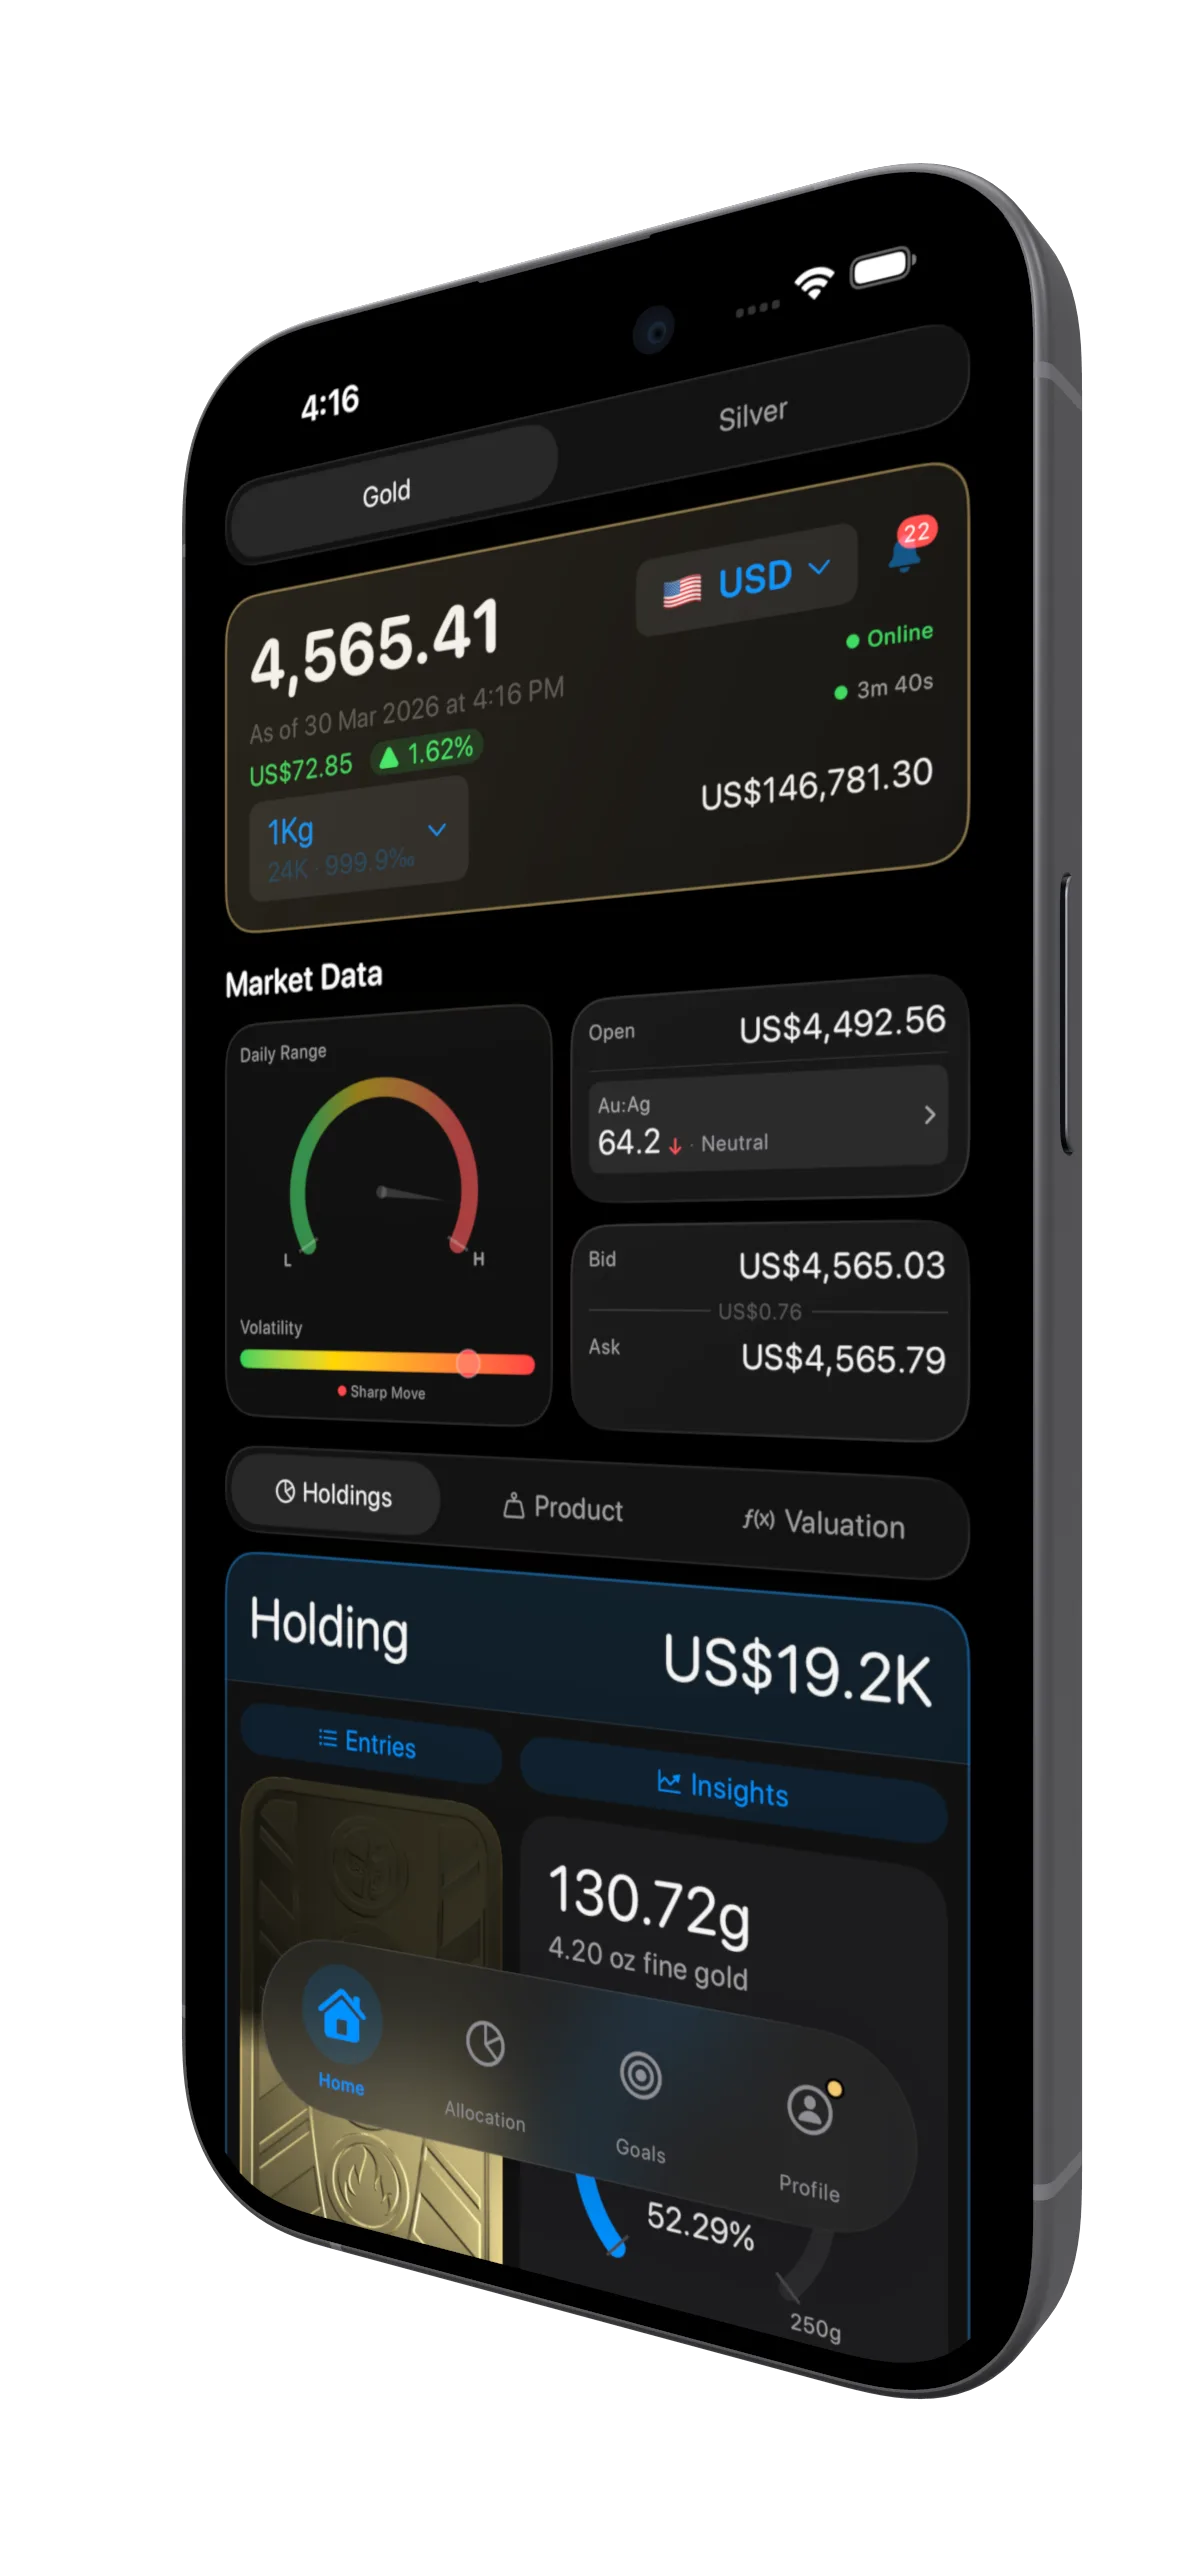
BullionCoin Network tracks every purchase, calculates your average cost per gram, and shows your portfolio against live spot — so you always know where your DCA stands.

Portfolio Performance
Live Spot Prices
This post references findings from our 10-year gold DCA backtest, which compares fixed-dollar vs. fixed-gram buying strategies using real monthly LBMA spot data from 2015–2025.
Spot prices referenced in this post exclude dealer premiums, taxes, and storage costs. Past performance does not guarantee future results. This is educational content, not financial, investment, or tax advice. The information presented reflects historical data and the author's interpretation — it is not a recommendation to buy, sell, or hold any asset.
Always do your own research and consult a qualified financial professional before making decisions about your money.