What Is the Gold-Silver Ratio (GSR)?
One number that tells you whether to lean gold or silver this month. Here's how to read it.
If you've been stacking for more than a few weeks, you've probably seen someone in a forum say something like “GSR is at 90, I'm going heavy silver.” And if you're newer to this, you probably thought — what are they talking about?
The Gold-Silver Ratio is one of those numbers that sounds complicated but really isn't. Once you understand it, you'll start checking it the same way you check spot price. Maybe more.
Let me break it down.
The Gold-Silver Ratio in Plain English
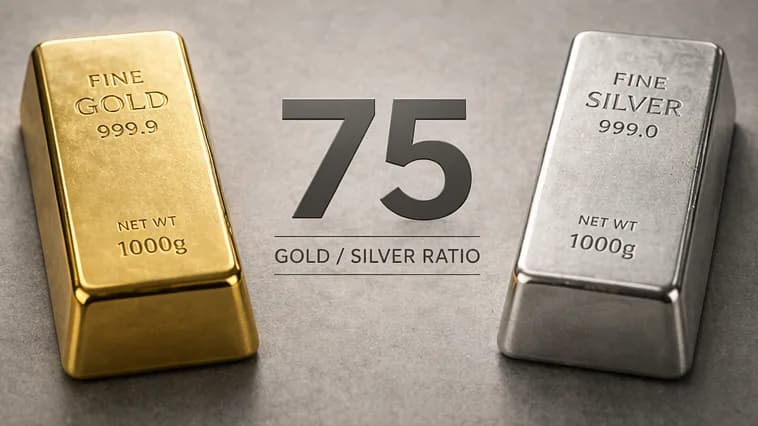
The GSR is dead simple. Take the current price of gold per ounce, divide it by the current price of silver per ounce. That's it.
If gold is at $3,000/oz and silver is at $30/oz, the GSR is 100. Meaning it takes 100 ounces of silver to buy a single ounce of gold.
That one number tells you something important: how expensive gold is relative to silver, or how cheap silver is relative to gold — depending on how you want to look at it.
It's not a price indicator. It's a relationship indicator. And that distinction matters more than most people realize.
Why One Number Gets So Much Attention
Here's the thing about spot prices — they move together. Gold goes up, silver usually follows. Gold drops, silver tends to drop harder. They're correlated, but they don't move in lockstep. The ratio between them stretches and compresses over time, and those swings create opportunities.
A high GSR (say, above 80) means silver is historically cheap relative to gold. A low GSR (below 60 or so) means silver is relatively expensive compared to gold — or put differently, gold is relatively cheap compared to silver.
Neither number tells you whether metals overall are going up or down. It only tells you which metal is a better relative deal at that moment.
That's why stackers who think in years and decades care about it so much. If you're accumulating physical metal anyway, you want to be accumulating the right metal at the right time.
A Quick Walk Through History
The ratio isn't some internet invention. People have been measuring gold against silver for literally thousands of years. Ancient civilizations fixed it by law — sometimes around 12:1 or 15:1. The United States officially set it at roughly 16:1 for much of the 1800s.
But in the modern era of floating prices, the ratio has ranged much wider:
- Long-term modern average: somewhere around 60–65, depending on what decades you include.
- 1991: the GSR hit the low 90s during a period when silver was deeply out of favor.
- 2011: during silver's run to nearly $50/oz, the ratio compressed all the way down to about 32. Silver was hot, and gold hadn't caught up proportionally.
- March 2020: the ratio spiked above 120 — the highest in modern recorded history. The pandemic panic crushed silver demand (industrial use collapsed) while gold surged as a safe haven.
- Early 2021: the ratio snapped back to the low 60s as silver recovered aggressively.
That 2020 spike and snapback is a textbook example of why people watch this number. If you were paying attention in March 2020 and shifted your buying toward silver, your silver holdings gained substantially more value over the next twelve months than if you'd kept buying gold.
Nobody can time the exact bottom or top. But the ratio gives you a framework for tilting your allocation in the right direction.
How Stackers Actually Use the GSR
There are generally two ways people apply this in practice, and they're not mutually exclusive.
1. Deciding What to Buy This Month
This is the simpler approach, and honestly, it's what most stackers do.
You have your monthly budget for metals. Instead of splitting it the same way every time, you let the GSR guide your allocation:
- GSR above 80? Lean heavier into silver. History says silver is cheap relative to gold at those levels. You're getting more metal per dollar on the silver side.
- GSR below 60? Lean heavier into gold. Silver's relative discount has narrowed, and gold becomes the better value play on a ratio basis.
- GSR in the 60–80 range? This is the gray zone. Most stackers just stick with their default split here, whatever that is.
There's no magic threshold. Some people use 70 as their pivot, others use 80. The point isn't precision — it's having a systematic reason for your allocation instead of just going with whatever feels right that week.
2. The Ratio Trade (Swapping Metals)
This is the more advanced play. Instead of just choosing what to buy, some stackers actively swap between metals based on the ratio.
The logic: if you bought silver when the GSR was at 90, and the ratio drops to 60, you can trade your silver for gold and end up with significantly more gold ounces than if you'd just bought gold the entire time. You're using silver's relative cheapness to eventually accumulate more gold.
You buy 90 oz of silver when the GSR is at 90 (cost equivalent to 1 oz of gold).
The GSR drops to 60.
You swap your 90 oz of silver for 1.5 oz of gold.
You've turned what was “1 ounce of gold worth” of value into 1.5 ounces of actual gold.
On paper, it's elegant. In practice, it's harder than it sounds. You have to account for dealer premiums on both the buy and sell sides, potential tax events depending on your jurisdiction, shipping costs, and the simple reality that the ratio might not move in the direction you expect on any particular timeline.
Still, the concept is sound over long timeframes. The ratio does mean-revert. It's just rarely in a hurry about it.
What Moves the Ratio?
Understanding why the ratio shifts helps you evaluate whether a move is likely to continue or reverse.
Industrial demand for silver is the big one. Silver has massive industrial applications — electronics, solar panels, medical devices, water purification. When the global economy is growing, industrial silver demand strengthens, and the ratio tends to compress (silver gains on gold). During recessions or slowdowns, industrial demand drops, silver gets hit harder than gold, and the ratio rises.
Safe-haven flows push the ratio up. When markets panic, big money floods into gold. Silver gets some of that too, but gold absorbs the lion's share. The more intense the fear, the higher the ratio goes. The 2020 spike was a perfect storm of this — extreme fear plus an actual collapse in silver's industrial demand.
Monetary policy and inflation expectations affect both metals but not equally. Gold responds more directly to macro monetary conditions (interest rates, money supply, central bank buying). Silver is caught between its monetary and industrial identities, making it more volatile and harder to predict in isolation.
Mining supply ratios matter over long periods. Annual mine production sits at roughly an 8:1 silver-to-gold ratio by weight. When the GSR sits at 80 or 90, you could argue silver is undervalued relative to how much is actually being pulled out of the ground — but production economics and market pricing don't always agree, and they can disagree for a long time.
Common Mistakes When Using the GSR
A few things to watch out for:
Don't treat it as a timing tool. The GSR tells you about relative value, not about when to act. A ratio of 85 could go to 100 before it comes back down. Using it as a general allocation guide works; using it to try to catch exact turns doesn't.
Don't ignore premiums. Spot price ratios and actual purchase ratios are different things. If silver premiums are running 25% above spot while gold premiums are at 3%, the effective ratio you're paying is quite different from the headline number. This matters a lot for physical stackers.
Don't forget about liquidity. Silver is bulkier, heavier, and generally has wider bid-ask spreads than gold. If you load up heavily on silver during a high-GSR period, you need to be comfortable with the logistical reality of storing and eventually selling a lot of physical weight.
Don't use the GSR in isolation. It's one tool, not the whole toolbox. It tells you nothing about whether metals in general are headed up or down. A GSR of 90 in a falling metals market means silver is cheap relative to gold, but both might still get cheaper in absolute terms.
Putting It All Together
The GSR isn't going to make anyone rich overnight, and it's not a crystal ball. What it does is give you a structured framework for a decision you're making anyway — how to split your precious metals buying between gold and silver.
If you're already stacking every month (and if you're reading this, you probably are or you're thinking about it), checking the ratio before each purchase takes about five seconds and can compound into a meaningful difference over years.
The stackers who get the most out of this number aren't the ones trying to trade it aggressively. They're the ones who let it gently steer their allocation over time, buying a bit more silver when it's historically cheap and a bit more gold when the ratio tightens. No drama, no panic, just a slight tilt in the right direction month after month.
That's it. That's the whole strategy.
For a deeper dive into recent GSR moves with real data, read: The GSR Went from 100:1 to 57:1 in 9 Months
Track the Ratio. Get Alerted When It Moves.
BullionCoin Network's Smart Alerts monitor the gold-silver ratio and notify you when it hits historically significant levels — so you don't have to check it yourself. See your portfolio's gold-to-silver allocation at a glance and let the ratio guide your next purchase.
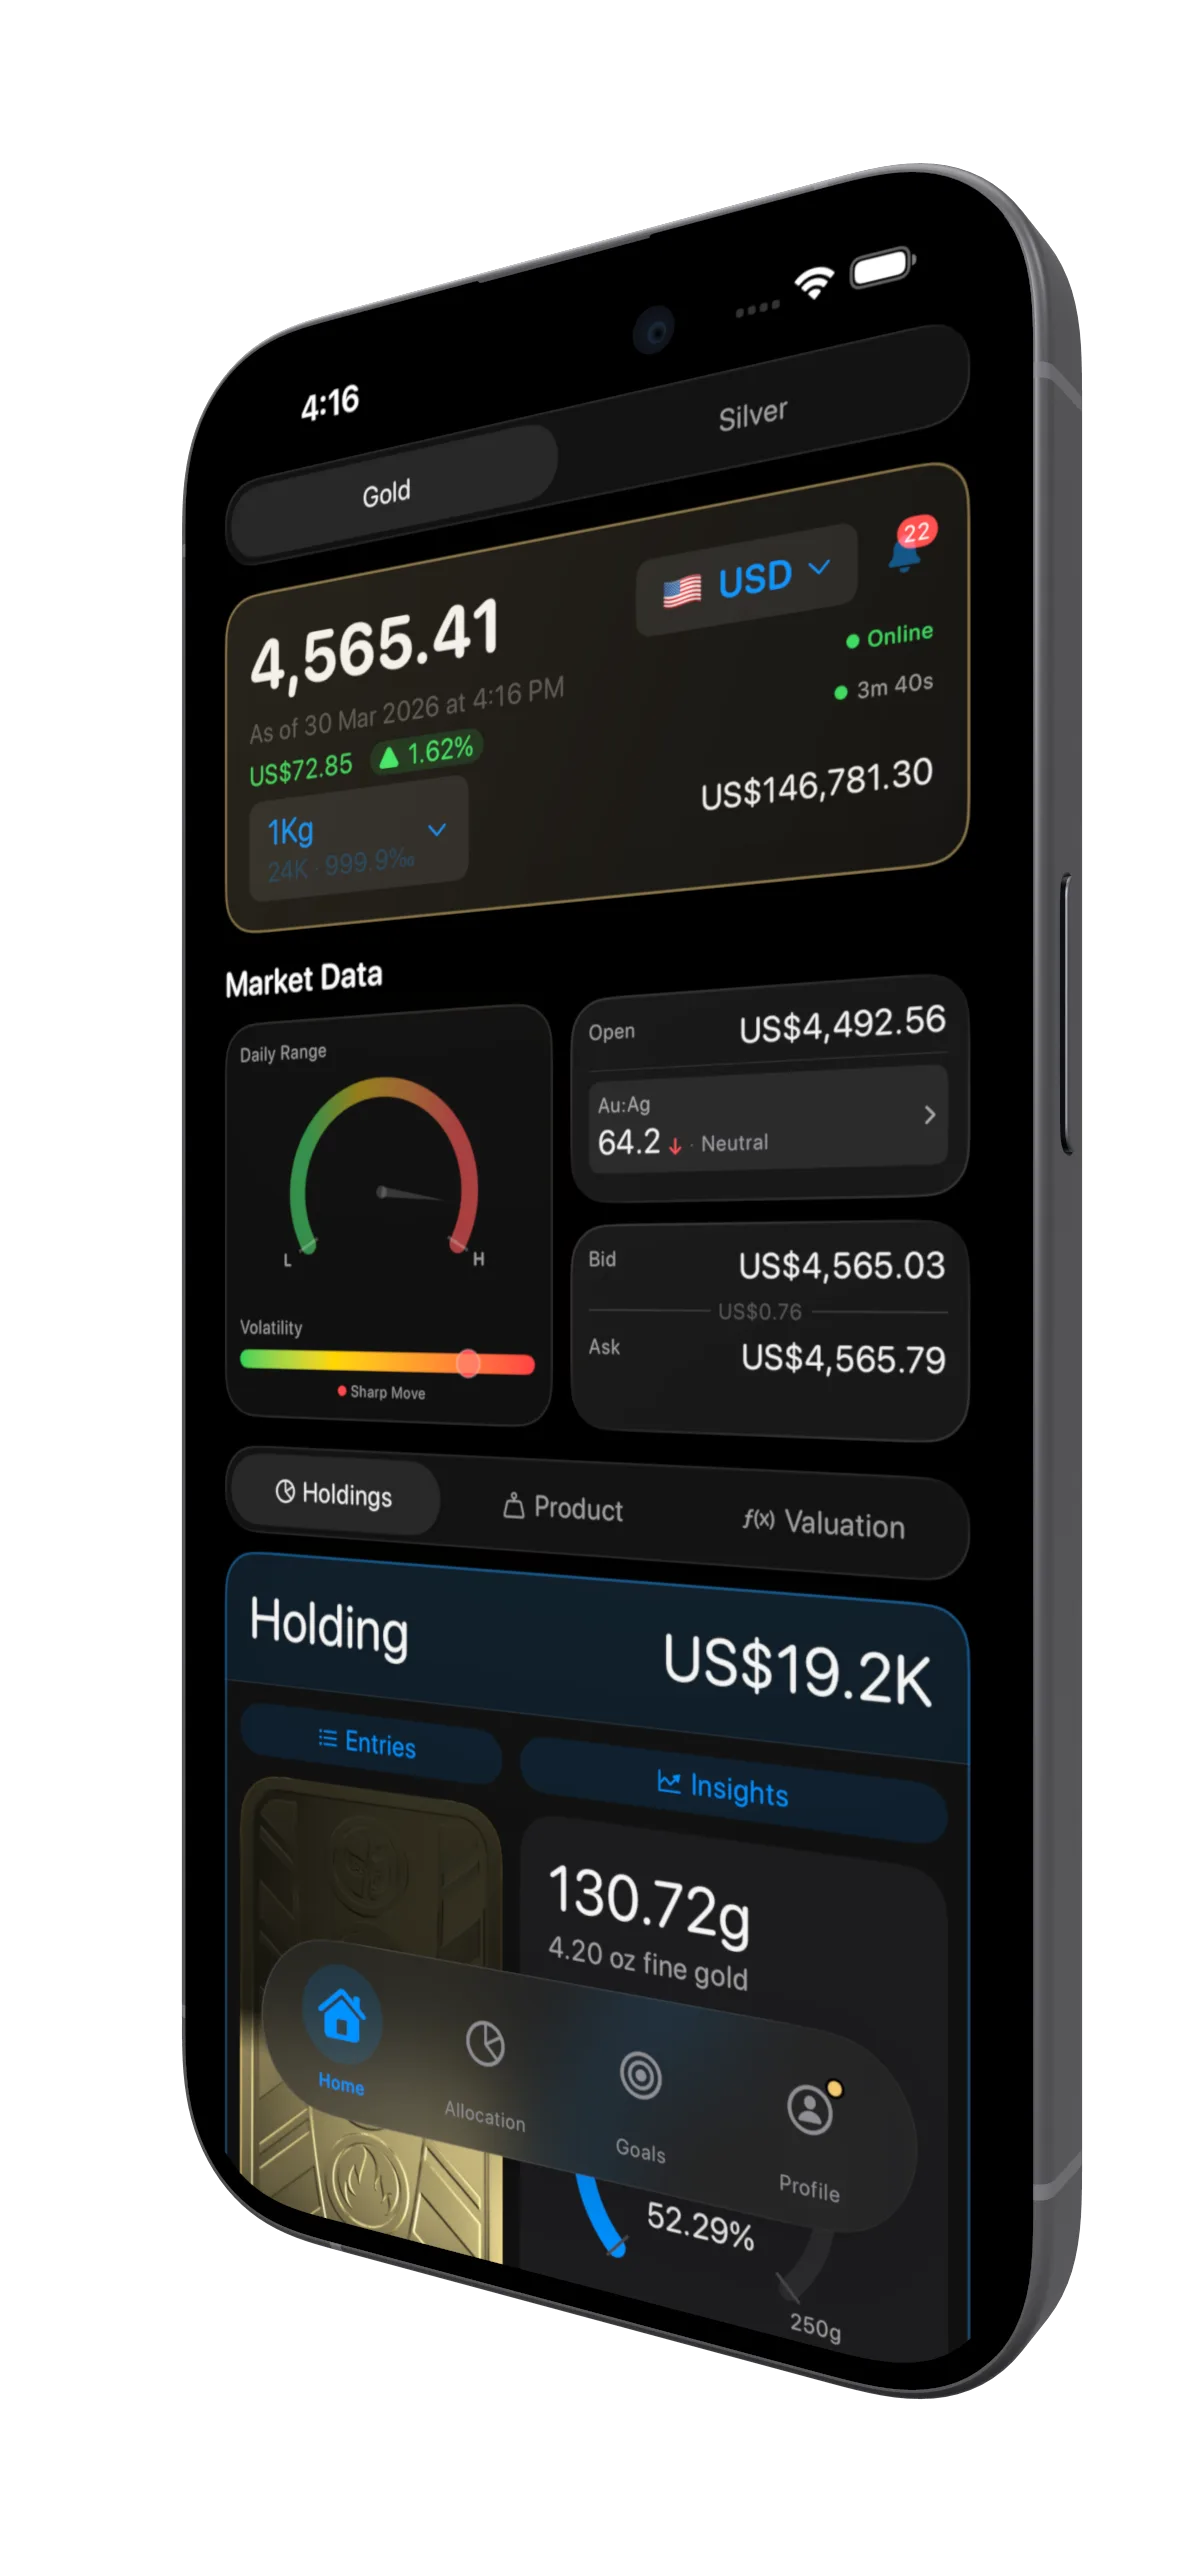
Portfolio Overview

Smart Alerts